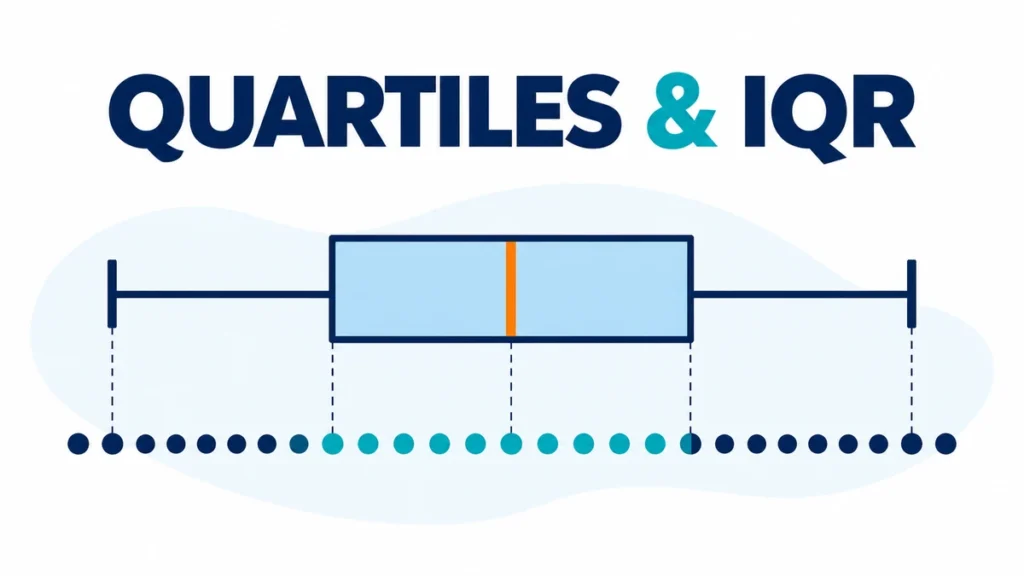
Quartiles split ordered data into four parts, while the interquartile range measures the width of the middle half. The first quartile, Q1, is the 25th percentile; Q2 is the median or 50th percentile; and Q3 is the 75th percentile. The interquartile range is IQR = Q3 − Q1.
What Do Quartiles And IQR Mean?
Quartiles mark the 25th, 50th, and 75th percentiles of ordered data. OpenStax Statistics defines Q1 as the 25th percentile, Q2 as the median, and Q3 as the 75th percentile. The IQR spans the middle 50% of the ordered observations in the data set.
Q1 separates the lowest quarter from the rest of the list. Q2 separates the lower half from the upper half. Q3 separates the highest quarter. These positions describe where values sit, not how far each individual value is from the mean.
The IQR is a measure of spread:
IQR = Q3 − Q1
A small IQR means the middle half is packed into a narrow interval. A large IQR means those central observations are more spread out. The IQR does not describe the lowest and highest quarters directly, so it should be read with the median and the full distribution.
Quartiles and percentiles are connected, but they use different naming systems. Percentiles divide position into 100 parts. Quartiles name three especially useful percentile cut points. Use the percentile calculator when you need a rank other than 25, 50, or 75.
How Do You Find Quartiles And IQR?
The worked list has 14 ordered values, so its median is the average of positions 7 and 8. OpenStax uses this exact data set and finds Q1 = 2, Q2 = 7, Q3 = 9, and IQR = 7.
Start with the values in increasing order:
1, 1, 2, 2, 4, 6, 6.8, 7.2, 8, 8.3, 9, 10, 10, 11.5
- Find Q2. The two middle values are 6.8 and 7.2, so Q2 = (6.8 + 7.2) ÷ 2 = 7.
- Form the lower half. It is 1, 1, 2, 2, 4, 6, 6.8. Its middle value is 2, so Q1 = 2.
- Form the upper half. It is 7.2, 8, 8.3, 9, 10, 10, 11.5. Its middle value is 9, so Q3 = 9.
- Subtract. IQR = Q3 − Q1 = 9 − 2 = 7.
You can check the positions before doing any subtraction. Seven observations sit in each half, Q1 is the fourth value of the lower half, and Q3 is the fourth value of the upper half. If your two halves contain different numbers of observations here, the split is wrong.
Which Quartile Convention Is Used Here?
SolverCalc uses the exclusive-median convention: find Q2, exclude that median when the list has an odd count, then take the medians of the lower and upper halves. OpenStax uses the same exclusion rule in its 15-value five-number-summary example, leaving 7 values in each half.
For an even count, no single observation is the overall median. Split the ordered list into two equal halves, then find each half’s median. That is what happens in the 14-value example, where the center lies between 6.8 and 7.2.
For an odd count, one observation is the overall median. Under this convention, do not place that observation in either half. For 1, 2, 3, 4, 5, the median is 3. The lower half is 1, 2 and the upper half is 4, 5, giving Q1 = 1.5 and Q3 = 4.5.
Use the Quartile & IQR Calculator for this convention. If your course, spreadsheet, or software names another method, use that method consistently and record it with your result.
Why Can Quartile Methods Give Different Answers?
Quartile software can use several valid definitions. The official R statistics documentation lists 9 quantile algorithms, including continuous interpolation methods. Small data sets expose these differences most clearly because a change of one position can move Q1 or Q3 noticeably.
The exclusive-median method treats quartiles as medians of two halves. An inclusive method may include the overall median in both halves. An interpolation method may place a quartile between two observations according to a fractional index. None of these labels alone tells you which answer your assignment expects.
Consider the ordered list 1, 2, 3, 4, 5. The exclusive-median convention gives Q1 = 1.5 and Q3 = 4.5. Including the median in each half gives Q1 = 2 and Q3 = 4. Both calculations describe the same five values, but they apply different position rules.
This is not a reason to average competing results. It is a reason to state the convention. When comparing groups, calculate every group with the same method. When checking homework, follow the method shown by the teacher or textbook. When reproducing software output, identify the program and quantile setting.
How Does IQR Identify Potential Outliers?
The common rule places fences 1.5 IQRs below Q1 and above Q3. OpenStax says values beyond those fences are suspected potential outliers and require investigation. For this example, the fences are −8.5 and 19.5, so no observed value crosses them.
Calculate the lower fence:
Q1 − 1.5(IQR) = 2 − 1.5(7) = 2 − 10.5 = −8.5
Calculate the upper fence:
Q3 + 1.5(IQR) = 9 + 1.5(7) = 9 + 10.5 = 19.5
The minimum is 1 and the maximum is 11.5. Both lie inside the fences. Therefore, the 1.5-IQR rule flags no potential outlier in this list.
A flagged value is not automatically wrong. It might be a data-entry mistake, an unusual but correct case, or the most informative part of the data. Check the original record, measurement process, and subject context before correcting or removing it. If you remove a value, report the reason and show how the summary changes.
How Do Quartiles Appear In A Box Plot?
A five-number summary contains 5 values: minimum, Q1, median, Q3, and maximum. OpenStax uses these values to construct box plots. The central box runs from Q1 to Q3, and a clear line inside the box marks the median value.
The box length represents the IQR. A median near the middle of the box suggests the central half is fairly balanced around it. A median pushed toward one side shows unequal spacing within the middle half. That pattern can suggest skew, but it should be judged with the whiskers and individual points.
Whiskers require a method note. In a modified box plot, each whisker ends at the most extreme observed value still inside the 1.5-IQR fence. Values beyond the whiskers appear as separate points. In a simpler classroom box plot, whiskers may be drawn directly to the minimum and maximum.
Those definitions match only when no potential outlier lies beyond a fence. In the worked example, 1 and 11.5 are both within −8.5 and 19.5. Therefore, the modified-box-plot whiskers also reach the observed minimum and maximum.
The Five Number Summary Calculator can organize the five landmarks. Always confirm the quartile convention and whisker rule before comparing its output with a graph from another program.
When Is IQR More Useful Than Range?
The range uses 2 endpoints, while the IQR focuses on the middle 50% of ordered observations. OpenStax defines the IQR as Q3 − Q1 and uses it to study central spread and potential outliers. This makes IQR less sensitive than range to one unusually high or low value.
Suppose most delivery times fall between 20 and 35 minutes, but one delayed order takes 120 minutes. The range reacts strongly because its maximum changes to 120. The quartiles may move little, so the IQR still describes the spread experienced by the central half of orders.
That resistance does not make IQR universally better. Range answers a different question: how far apart are the observed extremes? Use range when the full span matters, such as equipment limits. Use IQR when you need a stable description of central spread, especially for skewed data.
For a rounded view, report the median with the IQR and the minimum with the maximum. If the data are roughly symmetric without influential outliers, the mean and standard deviation may also be useful. The statistics calculators hub explains which summary matches each question.
What Common Mistakes Should You Avoid?
Quartiles always require data in ascending order, and the IQR always uses Q3 − Q1. OpenStax begins its quartile procedure by sorting the values and locating the median. Most wrong answers come from skipping that order, mixing methods, reversing the subtraction, or treating every flagged value as an error.
- Using the unsorted list. Positions have meaning only after the values are ordered.
- Confusing Q1 with the first observation. Q1 is the median of a lower section, not usually the minimum.
- Reversing the formula. Use Q3 − Q1 so the IQR is nonnegative.
- Mixing conventions. Do not find Q1 with one rule and Q3 with another.
- Calling a fence an outlier. A fence is a cutoff. Only an observed value beyond it is flagged.
- Deleting a flagged value automatically. Investigate it and document any decision.
- Assuming every whisker reaches an extreme. Modified box plots stop whiskers at the last value inside each fence.
A final reasonableness check catches many errors. Q1 should not exceed the median, and Q3 should not fall below it. The IQR should equal the visual width from Q1 to Q3. For the worked list, 2 ≤ 7 ≤ 9 and 9 − 2 = 7, so the results are internally consistent.
FAQs About Quartiles And IQR
The three quartiles correspond to the 25th, 50th, and 75th percentiles, according to OpenStax. The questions below resolve several common calculation details about the median, negative values, zero IQR, and outlier fences without changing the selected quartile convention or method.
Do You Include The Median When Finding Q1 And Q3?
SolverCalc uses the exclusive-median convention. If the list has an odd number of values, exclude the one overall median before finding the medians of the two halves. If the list has an even number of values, split it into equal halves because no single observation is the median.
Can The IQR Be Negative?
No. Ordered data always has Q3 greater than or equal to Q1, so Q3 − Q1 cannot be negative. An answer below zero usually means the subtraction was reversed. The IQR can be zero when the first and third quartiles are equal.
What Does An IQR Of Zero Mean?
An IQR of zero means Q1 = Q3, so the middle 50% has no numerical spread under the chosen method. The entire data set does not have to be constant. Values in the lowest or highest quarters may still differ from that shared quartile value.
Are Values On The Fences Potential Outliers?
The usual rule flags values below the lower fence or above the upper fence. A value exactly equal to a fence is normally kept inside. State the inequality used if a textbook or software package follows a different display rule.
Is The IQR The Same As The Middle 50%?
The middle 50% refers to the observations from Q1 through Q3. The IQR is the numerical width of that interval, Q3 − Q1. One is a portion of the ordered data; the other is a single measure of spread.
Sources
The definitions, exact 14-value example, IQR formula, and 1.5-IQR potential-outlier rule come directly from OpenStax. Its box-plot chapter supports the five-number-summary explanation. The official R manual documents multiple quantile algorithms and explains why statistical software can return different quartile values.