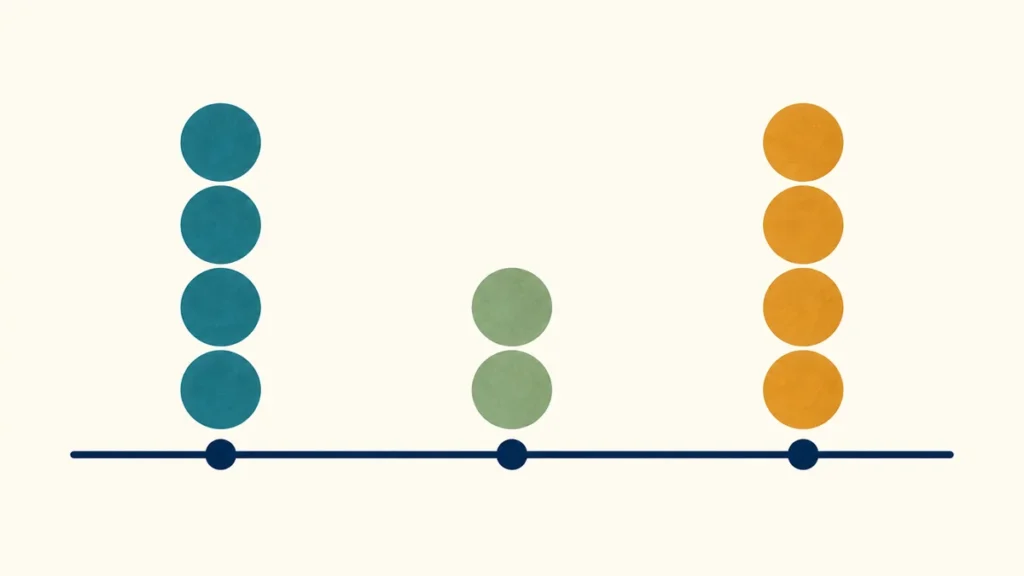
A dataset can have more than one mode because two or more values can share the highest frequency. In 1, 1, 5, 5, both 1 and 5 appear twice. Neither wins the count, so both are modes. The answer is a list of tied values, not their average.
The mode answers a count question: which value appears most often? It doesn’t ask which number is largest or which number sits in the middle. That difference explains why a small set can have two modes even when it has one mean and one median. Find related measures in the statistics tools hub.
This lesson uses invented datasets so you can check every count yourself. We’ll look at ties, color categories, rounding, and cases where different reporting rules give different answers. The goal is to explain what multiple modes tell you and what they leave unknown.
Why Do Frequency Ties Create Multiple Modes?
Multiple modes occur when several values tie for the largest count. A tie at a lower count doesn’t qualify. In 1, 1, 2, 2, 3, the counts are two, two, and one. That makes 1 and 2 the modes; 3 is not a mode.
OpenStax’s explanation of mode defines it by the highest frequency and allows several values to share that frequency. It calls a dataset with two modes bimodal. These names describe how many values share the top count.
A set with one most frequent value has one mode. For example, 2, 2, 2, 6, 6 has mode 2 because its count of three beats the count of two. A set with three tied leaders, such as 2, 2, 4, 4, 8, 8, has three modes: 2, 4, and 8.
Do the two modes need to be close? No. Frequency depends on repetition, not distance. The modes of 1, 1, 5, 5 are still 1 and 5. Their mean is 3, but 3 appears zero times. Averaging the tied modes would replace the answer with a different measure.
How Can You Check Every Mode?
Build a frequency table, find the highest count, and keep every value with that count. This prevents you from stopping at the first repeated value. It also keeps the largest number from looking like the winner simply because it appears last in a sorted list.
Try 2, 2, 2, 4, 4, 4, 9, 9. Start with one row per distinct value. Count each occurrence once. Sorting can make counting easier, but sorting doesn’t change the answer. The same eight observations have the same modes in any order.
| Value | Frequency | Mode? |
|---|---|---|
| 2 | 3 | Yes |
| 4 | 3 | Yes |
| 9 | 2 | No |
The largest frequency is three. Both 2 and 4 reach it, so both are modes. The value 9 repeats, but its count of two falls short. Repetition alone isn’t enough. A mode must match the largest count across the entire dataset.
Check the table by adding its frequencies: 3 + 3 + 2 = 8. That total must match the number of original observations. If it doesn’t, you may have missed a value, counted one twice, or split a single value across two rows. Use the mean, median, and mode calculator to check your numerical list.
A frequency column can also represent repeated observations without writing each one out. A row saying “value 2, frequency 3” means three actual 2s. An importance weight of three means something else. Don’t turn ratings of importance into occurrence counts unless that is the task you intend.
Can Categories Have More Than One Mode?
Categories can have multiple modes because finding a mode only requires counting matches. Suppose an invented shirt list contains three red shirts, three blue shirts, and one green shirt. Red and blue tie for the highest frequency, so both colors are modes.
You don’t need to add colors or place them on a number line. Write each color as a category, then count its shirts. The order of the rows doesn’t matter. Putting green first in the table won’t make it more common.
The mean of these color names is undefined. There is no arithmetic rule that adds red to blue and divides the result by seven. Mode works here because it keeps the category names and asks how often each one appears.
Number codes don’t change that limit. If red is code 1, blue is code 2, and green is code 3, averaging the codes doesn’t produce an average shirt color. Changing the codes would change that average even though the shirts stayed the same.
Ordered categories need care too. Codes for small, medium, and large may show order, but they don’t prove equal size gaps. Count their frequencies to find the mode. Only average numerical measurements when their meaning supports arithmetic.
When Does A Dataset Have No Mode?
For this lesson, a dataset where every value occurs once is reported as having no mode. That is a common introductory reporting convention. State the rule when it matters, because another definition can treat every value tied for the highest frequency as a mode.
Consider 1, 4, 7, 10. Every count is one, and no value stands out through repetition. Under our convention, the answer is “no mode.” Under a rule that includes all maximum-frequency values, the answer is the list 1, 4, 7, 10.
Neither calculation has changed the counts. The difference lies in how the tie is reported. If a teacher, assignment, or software tool uses a specific convention, follow it and make the choice clear. Don’t mistake a difference in labels for a counting error.
Compare that case with 7, 7, 7. There is only one distinct value, and it appears three times. Its mode is 7. All observations being equal doesn’t create several modes; several different values must share the largest frequency for that to happen.
An empty dataset has no observed values to count. Its mode is undefined. That’s a different situation from four values that each appear once. A useful report distinguishes “no observations” from “no mode under the chosen convention.”
How Do Rounding And Groups Change Modes?
Rounding and grouping can change which observations count as matches. In the illustrative data 1.1, 1.2, 1.2, 1.3, the exact-value mode is 1.2. Round every observation to the nearest whole unit, and the recorded list becomes 1, 1, 1, 1, with mode 1.
Both answers describe their own version of the data. The first uses values recorded to tenths. The second uses whole units. Reporting “the mode is 1” without mentioning rounding hides information about how that answer was formed.
What if you’re looking at a histogram instead of a list? A histogram counts observations inside ranges called bins. Its tallest bar identifies a most populated range. That range is not automatically the most frequent exact value inside it.
For example, 1.1, 1.2, 1.3, and 2.1 each appear once. A bin from 1 up to, but not including, 2 contains three observations. That bin wins the grouped count, although none of its three exact values repeats.
Changing bin widths or boundaries can combine nearby observations or separate them. That can create a tie between bins or remove one. When discussing histogram peaks, give the bin rule and call them peak bins. Keep them separate from exact-value modes.
Measurement detail also limits what a sample can reveal. A mode based on rounded readings describes those readings. It doesn’t establish the exact most common value in a whole population, especially when finer measurements could separate values that currently match.
What Can A Small Change Tell You?
One added observation can break a frequency tie. Start with 1, 1, 5, 5, which has modes 1 and 5. Add one more 5. Now 5 appears three times and 1 appears twice, so the updated dataset has only one mode: 5.
This change shows why a mode from a small dataset may be fragile. You don’t need a large new value to change it. One ordinary observation can shift the leading count. Keep the size of the sample visible when you report its modes.
Moving a rare outlier farther away has a different effect. In 1, 1, 5, 5, 100, change 100 to 1,000. The counts stay two, two, and one, so the modes stay 1 and 5. Their frequencies don’t depend on the outlier’s distance.
That statement has a condition: the changed value must remain distinct. Change 100 to 5 instead, and you add to an existing count. The mode becomes 5. It’s the match with another observation, rather than the distance moved, that changes the result.
Two sample modes also don’t prove that two hidden populations exist. A tie could arise from a small sample, rounded measurements, or chance. Separate groups may be worth investigating, but you need evidence about those groups before claiming that the modes identify them.
How Should You Report Multiple Modes?
Report all tied leading values, their shared frequency, and the total number of observations. For 1, 1, 5, 5, write: “The modes are 1 and 5; each occurs twice in four observations.” This gives the result and enough detail to check it.
Don’t average the list of modes. Its purpose is to preserve the tie. Also keep mode separate from median: in this four-value example, the median is 3, while the modes are 1 and 5. If you need several summaries, label each one clearly. Our median versus mean lesson explains when those two summaries tell different stories.
Finish by stating any rule that affects the count: rounding, category labels, bin boundaries, or the convention for unique values. A clear mode report tells readers what was counted, which values tied, and how the data were recorded. Those details make the answer useful beyond a single number.