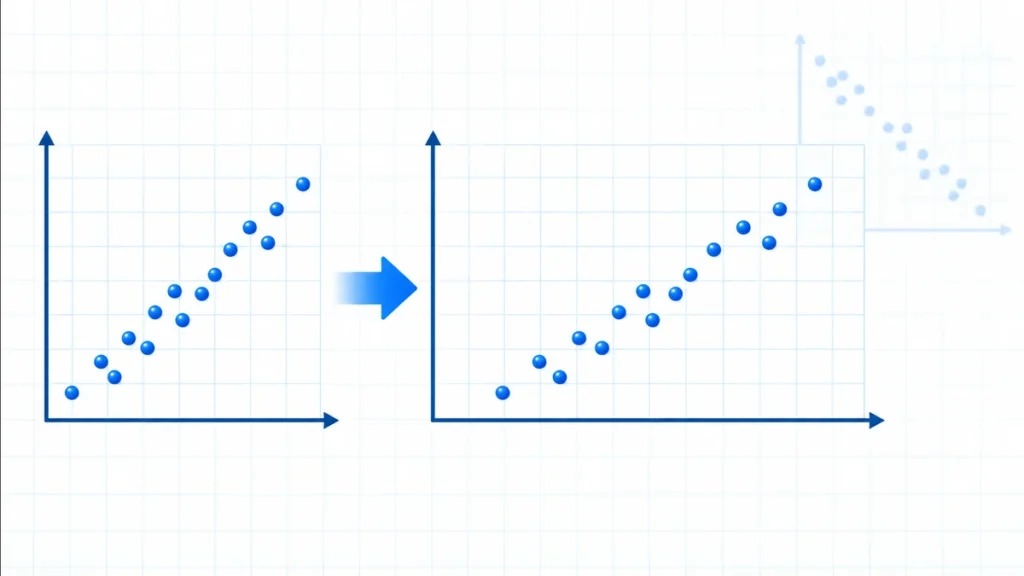
Pearson correlation stays the same when you add a constant or convert either variable with a positive linear scale. Converting inches to centimeters changes every height by the same factor, but it does not change the standardized pattern of the paired data. A negative scale applied to exactly one variable flips the sign of r; applying negative scales to both variables preserves r.
This property explains why the same height and weight data have one correlation whether height is recorded in inches or centimeters. The slope of a fitted line changes with the units, but the correlation does not. Correlation measures the strength and direction of a linear pattern after unit sizes have canceled.
We will prove the rule, test it with a small invented dataset, and mark the cases where the shortcut fails. Use the statistics tools hub for related calculations and explanations.
What Does Correlation Measure?
Pearson’s correlation coefficient, usually written r for a sample, measures the direction and strength of a linear relationship between two numerical variables. Its value lies from -1 through 1. A positive sign means the variables tend to rise together, while a negative sign means one tends to fall as the other rises.
A value near 1 or -1 indicates a tight straight-line pattern. A value near zero indicates weak linear association, but it does not prove that no relationship exists. A curved pattern can have a correlation near zero even when the variables are strongly related in a non-linear way.
Penn State’s linear regression lesson lists correlation as unit-free and explains that it has the same value when the roles of x and y are exchanged. Those properties come from the way covariance is divided by the two standard deviations.
r = covariance of x and y ÷ (standard deviation of x × standard deviation of y)
Covariance carries the product of the variables’ units. If x is measured in centimeters and y in kilograms, covariance uses centimeter-kilograms. The two standard deviations use centimeters and kilograms. Dividing cancels both units, leaving a pure number.
Why Do Measurement Units Cancel?
Correlation compares standardized deviations rather than raw unit sizes. For each observation, subtract the variable’s mean and divide by its standard deviation. The resulting z-score tells how many standard deviations the observation lies above or below its mean.
zx = (x – x̄) ÷ sx
Suppose a height is 2 inches above the mean and the height standard deviation is 4 inches. Its standardized value is 2 ÷ 4 = 0.5. Convert both measurements to centimeters and they become 5.08 and 10.16. The ratio remains 5.08 ÷ 10.16 = 0.5.
Correlation combines matching standardized values for all pairs. Because a positive unit conversion leaves every z-score unchanged, it also leaves their combined correlation unchanged. The scale affects the labels on the axes, not the relative positions measured in standard deviations.
This cancellation is why correlation has no measurement unit. Reporting r = 0.72 centimeters per kilogram would be incorrect. The number 0.72 describes linear association, not a conversion rate or a regression slope.
What Happens Under A Positive Unit Conversion?
A positive linear conversion has the form x* = ax + b with a greater than zero. The multiplier a changes the unit size. The constant b can change the zero point. Celsius to Fahrenheit, for example, uses both operations.
Subtract the new mean from a converted value. The added constant b cancels, leaving a times the old deviation. The new standard deviation is a times the old standard deviation. Dividing the new deviation by the new standard deviation cancels a, so the z-score stays the same.
(x* – x̄*) ÷ sx* = a(x – x̄) ÷ (a sx) = (x – x̄) ÷ sx
Consider the invented pairs (1, 2), (2, 5), (3, 4), and (4, 8). Changing x from meters to centimeters multiplies every x-value by 100. The cloud of points becomes wider on the labeled graph, yet each standardized x-position is unchanged. The value of r is unchanged too.
The Penn State clinical trials lesson states that Pearson correlation is invariant to location and scale transformations. That statement applies to nonzero linear scale changes, with sign behavior handled carefully. It does not say that every possible mathematical transformation preserves correlation.
A conversion may change the regression slope. If y is unchanged while x is multiplied by 100, the slope per x-unit becomes one hundredth as large. This is not a contradiction. Slope answers how much y changes for one x-unit, while correlation answers how closely the standardized points follow a line.
Why Does A Negative Scale Flip The Sign?
Multiplying one variable by a negative number reverses its order. Values that were above the mean move below it, and values below the mean move above it. Each standardized value changes sign, so every standardized product changes sign. Correlation therefore changes from r to -r.
Temperature gives a simple constructed example. Define a reversed score x* = -x. If high x-values were paired with high y-values, high x*-values now correspond to low original x-values. The same points reflect across a vertical axis, turning an upward trend into a downward trend.
If both variables are multiplied by negative numbers, both standardized signs reverse. The two negatives cancel in each product, so the original correlation returns. Changing only one axis flips the sign; changing both axes does not.
A zero multiplier is not allowed for this rule. Multiplying every x-value by zero makes all x-values identical. Their standard deviation becomes zero, and Pearson correlation is undefined because its formula would divide by zero.
Why Does Adding A Constant Change Nothing?
Adding a constant moves every value by the same amount without changing any deviation from the mean. Add 10 to every x-value, and the x-mean also rises by 10. The difference x – x̄ stays exactly the same.
This is called a location shift. Converting Celsius to Kelvin adds 273.15. Ages measured in calendar years might shift when a different reference date is chosen. As long as every observation receives the same addition, the scatterplot slides without changing its shape.
The standard deviation also stays unchanged under addition. Since covariance uses deviations from means, covariance stays unchanged when a constant is added to either variable. The numerator and denominator of r therefore stay the same.
Do not confuse adding one constant to every observation with adding different corrections to different observations. Individual adjustments can reshape the point cloud and change r. The invariance rule requires one consistent linear conversion for the whole variable.
Which Transformations Can Change Correlation?
Nonlinear transformations can change Pearson correlation because they change the shape and spacing of the point cloud. Squaring, taking logarithms, or using reciprocals does not simply stretch the axis evenly. Even when order is preserved, the distances between values can change by different amounts.
Penn State’s discussion of numerical summaries notes that correlation is invariant to linear changes of units, but correlation between x and y need not equal correlation between log(x) and log(y). A log transformation may straighten a curved relationship, compress large values, or expand distinctions among small values.
Outliers can also change correlation strongly. Unit conversion does not remove an outlier because that point keeps its standardized position. Changing or deleting observations is not a unit conversion and needs a substantive, documented reason.
Correlation is not proof of causation. A stable r after converting units only shows that the same linear association was represented on a different scale. It does not identify a cause, rule out a third variable, or show that a prediction is safe outside the observed range.
How Can You Check A Transformed Dataset?
First identify the transformation. A positive expression ax + b preserves r. A negative multiplier on one variable flips its sign. A zero multiplier makes correlation undefined. A nonlinear rule needs recalculation rather than a shortcut.
Next compare the paired rows. Unit conversion must keep each x-value paired with its original y-value. Sorting one column without sorting the other changes the pairs and can produce a completely different result. The mathematics cannot repair mismatched data.
Use the correlation calculator to enter a small dataset, then convert one column and calculate again. Positive unit changes should reproduce r apart from display rounding. Standardized values from the z-score calculator provide another way to see why.
Finally, compare more than the coefficient. Keep a scatterplot, check unusual points, and state the variables and units even though r itself is unitless. The context still matters. Correlation preserves a linear pattern under valid unit conversion, but it does not preserve every feature of a data analysis.