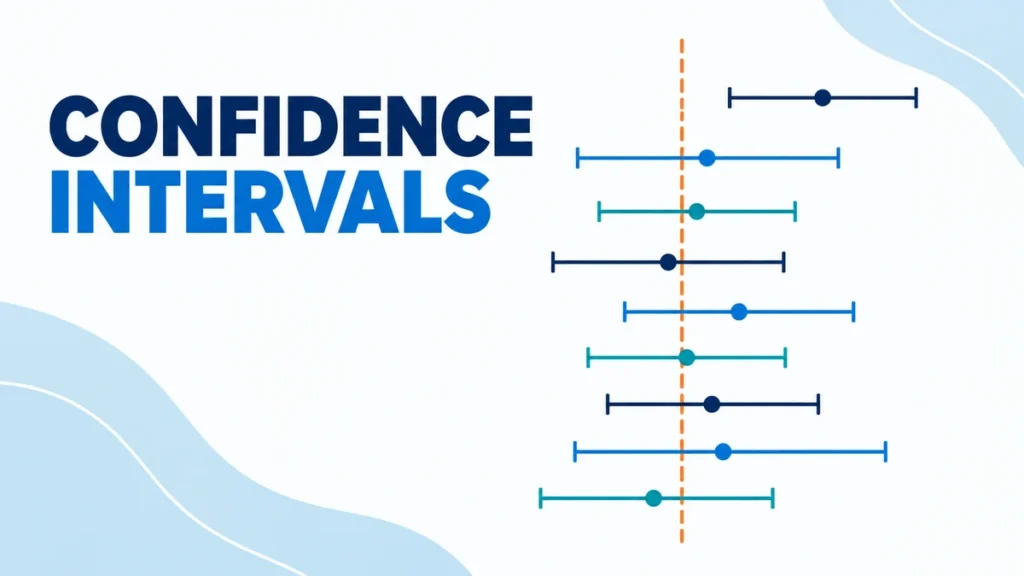
A confidence interval uses sample data to estimate a population value with a range instead of a single number. The interval combines a point estimate with uncertainty from random sampling. It does not prove that every value inside the range is equally plausible, and it does not guarantee that this particular interval captured the true parameter.
The meaning depends on what you estimated, how you sampled, and which method you used. This guide explains confidence intervals for means and proportions, shows a complete calculation, and separates them from prediction intervals. Visit the statistics hub for related tools and lessons.
What Does A Confidence Interval Estimate?
A confidence interval estimates one unknown population parameter with two endpoints. NIST explains that a 95% procedure captures the true mean in about 95% of repeated samples. The interval therefore describes uncertainty in an estimate, not the spread of individual observations.
The parameter might be a population mean, proportion, difference, slope, or another quantity. The center is usually a statistic calculated from the sample. The endpoints show how far sampling uncertainty allows that estimate to extend under the chosen model and confidence level.
A useful reading test is to name the noun after “population.” If the noun is mean, interpret the interval as a range for a mean. If it is proportion, interpret it as a range for a proportion. This simple check prevents a common switch from parameter uncertainty to individual-value spread.
How Is A Confidence Interval Built?
A common two-sided interval has three parts: point estimate, standard error, and critical value. OpenStax gives 1.96 as the 95% normal critical value. Multiplying that value by the standard error produces the margin of error used for both endpoints.
The general pattern is:
confidence interval = point estimate ± critical value × standard error
The point estimate identifies the center. The standard error measures how much that statistic would vary across repeated samples. The critical value sets how much of the sampling distribution the method covers. Together, the critical value and standard error determine the margin of error.
For a population mean with known population standard deviation, the standard error is σ ÷ √n. The interval is x̄ ± z* × σ ÷ √n. When σ is unknown and sample standard deviation s replaces it, a one-sample t interval is usually used instead.
How Do You Calculate A 95% Confidence Interval?
For a 95% interval with known σ, use z* = 1.96. OpenStax places 0.025 in each tail and 0.95 in the center. With x̄ = 12.5, σ = 6.3, and n = 50, the resulting interval is about 10.75 to 14.25.
- Find the standard error: 6.3 ÷ √50 ≈ 0.891.
- Find the margin of error: 1.96 × 0.891 ≈ 1.747, which rounds to 1.75.
- Find the lower endpoint: 12.5 − 1.75 = 10.75.
- Find the upper endpoint: 12.5 + 1.75 = 14.25.
Report the answer as approximately (10.75, 14.25). Rounding the standard error too early can slightly change the endpoints, so keep extra digits until the last step. Include the original units and identify the population mean being estimated.
The calculation assumes that σ = 6.3 is the population standard deviation, not an estimate from the same sample. If 6.3 were the sample standard deviation, the multiplier should come from a t distribution with 49 degrees of freedom, subject to the method’s conditions.
What Does 95% Confidence Really Mean?
A 95% confidence level belongs to the method, not to a moving population parameter. NIST states that roughly 95% of intervals from repeated samples of the same size would contain the true mean. Once calculated, one interval either contains that mean or it does not.
A clear interpretation is: “We are 95% confident that the population mean lies between 10.75 and 14.25 units.” This wording connects the confidence level, target parameter, interval, and units. It also avoids treating the endpoints as limits for individual observations.
Do not say that 95% of the data lie inside the interval. That question concerns the distribution of observations. Also avoid saying that 95% of population means lie inside it. The population has one fixed mean; repeated samples produce different intervals.
The probability wording fails because the frequentist parameter is fixed while endpoints vary across samples. Probability describes the long-run procedure before sampling. A Bayesian credible interval uses a different framework, so do not treat the two terms as interchangeable.
When Should You Use Z Instead Of T?
Z and t intervals differ mainly in how they handle the population standard deviation. NIST gives a t formula with n − 1 degrees of freedom when s estimates σ. Use z for a mean when σ is known; use t when σ is unknown and estimated by s.
The t distribution has heavier tails than the normal distribution. That extra width accounts for uncertainty from estimating σ. With 49 degrees of freedom, the two-sided 95% t critical value is a little larger than 1.96, so its margin of error is slightly larger than the z version.
As degrees of freedom increase, the t distribution approaches the standard normal distribution. That does not make z the automatic choice for every large sample. A t interval remains the standard method for a mean when σ is unknown, and software handles the critical value easily.
What Conditions Must Be Checked?
A formula cannot repair biased data. OpenStax uses a sample size of at least 30 or a normal population as a mean-interval guideline, but random selection and independence still matter. Severe skew or outliers can make a small-sample t interval unreliable.
- Representative sampling: the observations should come from a design that can represent the target population.
- Independence: one observation should not determine another unless the method models that dependence.
- Suitable shape or sample size: inspect strong skew and extreme values, especially in small samples.
- Correct parameter: choose a method for a mean, proportion, difference, or other stated target.
- Consistent units: the estimate, standard deviation, margin, and endpoints must use compatible units.
Separate calculation checks from design checks. Arithmetic can be flawless while the interval remains misleading because volunteers replaced a random sample or missing responses favored one group. The calculator sees numbers; the analyst must judge how those numbers were produced.
What Makes A Confidence Interval Wider Or Narrower?
Interval width grows with variability and confidence, but shrinks with sample size. NIST shows the standard error changing with 1 ÷ √n. Therefore, multiplying the sample size by 4 cuts the standard error and margin of error in half when other inputs stay fixed.
Higher confidence requires a larger critical value. For the normal model, common two-sided values are 1.645 for 90%, 1.96 for 95%, and 2.576 for 99%. Raising confidence while holding the data constant makes the interval wider because the method must cover more of the sampling distribution.
There is no free precision. A narrower interval can come from more information, a lower confidence level, or a less variable process. Only the first option usually improves precision without weakening the intended confidence. Use the sample size calculator to explore how a target margin changes the required survey size.
How Do Mean, Proportion, And Prediction Intervals Differ?
Different targets require different standard errors. OpenStax checks that both n p̂ and n(1 − p̂) are at least 5 for its normal proportion procedure. A mean interval uses x̄ and a mean standard error; a proportion interval uses p̂ and a proportion standard error.
| Interval | Target | Typical center | Main caution |
|---|---|---|---|
| Mean confidence interval | Population mean | Sample mean x̄ | Check sampling, shape, and whether σ is known |
| Proportion confidence interval | Population proportion | Sample proportion p̂ | Check binary outcomes and method conditions |
| Prediction interval | Future observation or future mean | Model prediction | Includes future outcome variation |
A prediction interval answers a different question. It aims to cover a future observation or future set of observations. NIST explains that a new-observation prediction interval is wider than a confidence interval for the fitted mean because it includes both estimation uncertainty and new-observation noise.
Use the interval named by the research question. Estimating an average waiting time calls for a confidence interval for the mean. Predicting the waiting time for the next customer calls for a prediction interval. The second task must account for individual variation that the first task does not try to cover.
Which Confidence Interval Mistakes Matter Most?
At 95% confidence, α = 0.05 and each tail receives 0.025 in a two-sided normal interval. OpenStax connects those tail areas to z* = 1.96. Using 0.05 in each tail would build a different confidence level and a narrower interval.
- Wrong target: interpreting a range for a mean as a range for individual values.
- Wrong multiplier: using z when t or another method is required.
- Wrong standard error: using standard deviation alone without dividing by √n for a mean.
- Wrong probability claim: assigning 95% probability to the fixed parameter after the interval is observed.
- Ignored design: treating a convenience sample as though it were random and representative.
- False certainty: reporting many decimals even though inputs and assumptions are much less precise.
Also avoid reading “not statistically significant” as “no effect.” An interval may include a null value because the estimate is imprecise. Its width and endpoints show which values remain compatible with the method and data. Practical importance still depends on context, units, costs, and consequences.
A z-score calculator can help verify normal critical values, but a critical value is only one part of the interval. The correct parameter, standard error, design, and interpretation must all agree.
FAQs About Confidence Intervals
Several recurring questions involve the same three common confidence levels. NIST lists 90%, 95%, and 99% as often-used choices and identifies 95% as the most common. The best choice still depends on the consequences of missing the parameter and the precision required.
Is A 99% Confidence Interval Always Better Than A 95% Interval?
No. A 99% interval has higher long-run coverage but is wider with the same data. Its normal critical value is about 2.576 rather than 1.96. Choose the level before looking at the result, and balance coverage against the precision the decision needs.
Does A Larger Sample Remove Bias?
No. Increasing n from 100 to 400 halves the standard error in common formulas because √400 is twice √100. It does not fix poor measurement, nonresponse, or biased selection. A very large biased sample can produce a narrow interval around the wrong target.
Can Two Overlapping Intervals Still Represent A Meaningful Difference?
Yes. Overlap between two separate 95% intervals is not a complete test of their difference. The needed standard error depends on whether samples are independent, paired, or otherwise related. Build an interval for the difference directly instead of judging only by visual overlap.
Should Every Confidence Interval Be Symmetric?
No. The familiar point estimate ± margin form is symmetric, but not every valid method has that shape. OpenStax notes that intervals for quantities such as standard deviation can be nonsymmetric. Transformations, exact methods, and bootstrap methods can also produce unequal distances from the estimate.
Sources And Next Steps
NIST identifies 90%, 95%, and 99% as commonly used confidence levels, while OpenStax gives 1.96 for a two-sided 95% normal interval. These sources support the definitions, formulas, and interpretation used here. Check your course, software, or study protocol for the required method before calculating.
- NIST/SEMATECH: Confidence Limits For The Mean
- OpenStax Statistics: Confidence Intervals Introduction
- OpenStax Statistics: A Single Population Mean Using The Normal Distribution
- OpenStax Principles Of Data Science: Statistical Inference And Confidence Intervals
- NIST/SEMATECH: Prediction Intervals
Before reporting an interval, name the parameter, check the design and assumptions, show the endpoints with units, and write one sentence interpreting the confidence level. Those steps turn a pair of numbers into a defensible statistical statement.