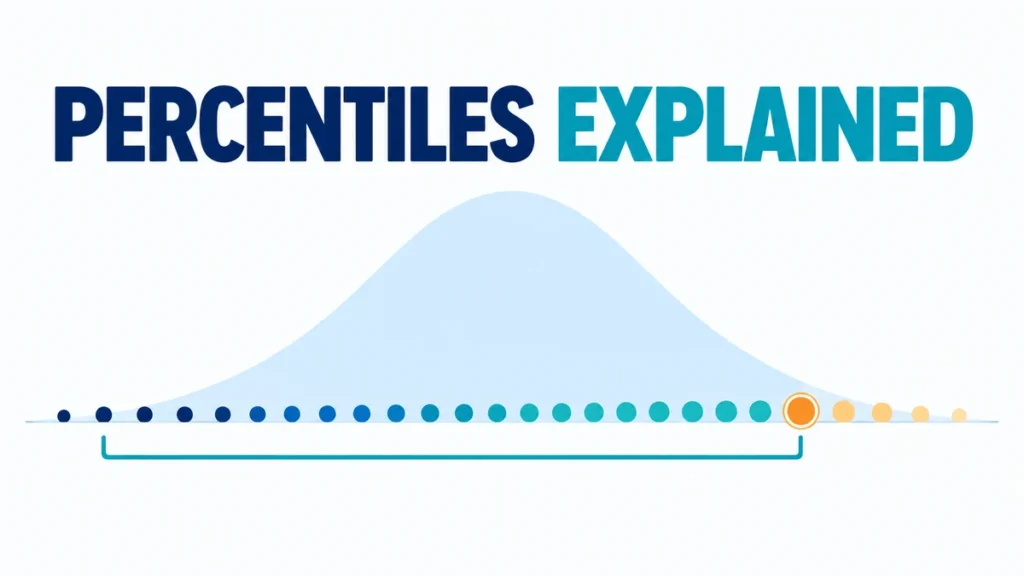
A percentile describes where a value stands within an ordered group. If a score is at the 90th percentile, about 90% of the scores are at or below it. That does not mean the person answered 90% of the questions correctly.
Percentiles are useful for test scores, growth charts, measurements, and any situation where relative position matters. However, a percentile can be calculated in several valid ways. Small data sets may produce noticeably different answers, so the method should be named when precision matters.
Use the percentile calculator to check a data-set calculation, or visit the statistics tools hub for related measures of center, spread, and position.
What Does A Percentile Mean?
A percentile marks a location in ordered data. OpenStax explains that percentiles divide ordered values into hundredths, while the 50th percentile is the median. The 25th and 75th percentiles are also called the first and third quartiles. (OpenStax, accessed 2026)
The wording around a percentile needs care because ties can occur. Saying “at or below” is often clearer than saying “below.” If several people earn the same score, they may occupy the same position even though a simple rank list gives them separate row numbers.
A percentile is not automatically good or bad. A high percentile may be desirable for an exam score but undesirable for completion time, blood pressure, or repair cost. Interpret the direction only after identifying what the measured variable represents.
How Is A Percentile Different From A Percentage?
A percentage measures a part out of 100. A percentile compares a value with other values. OpenStax notes that a 90th-percentile test result does not necessarily mean a 90% test score. It means about 90% of scores are the same or lower. (OpenStax, accessed 2026)
For example, 42 correct answers out of 50 is 84%. Whether that score is the 60th or 95th percentile depends on everyone else’s scores. A difficult test can produce a high percentile from a modest percentage, while an easy test can produce a lower percentile from a strong percentage.
| Measure | Question answered | Example |
|---|---|---|
| Percentage | What share of the total? | 42 of 50 = 84% |
| Percentile | Where does the value stand? | Higher than or equal to about 90% of scores |
| Percentile rank | What percent of values meet a ranking rule? | 80% at or below a selected value |
Do not convert a percentage directly into a percentile without a reference distribution. The conversion requires either the actual comparison data or a justified probability model. A test publisher may also use a carefully defined norm group rather than the scores from one classroom.
What Is A Percentile Rank?
A percentile value works from a requested position to a data value. Percentile rank goes in the other direction: it starts with a data value and estimates its relative standing. One common classroom rule counts observations at or below the value, divides by the total count, and multiplies by 100.
For the ordered data 2, 4, 7, 9, 15, four of five values are at or below 9. Under that rule, 9 has a percentile rank of 4 ÷ 5 × 100 = 80. State the counting rule because another convention may treat ties or the selected value differently.
Some reports use a midrank rule, counting all lower values plus half of the tied values. This can be helpful when many observations are equal. It also means two systems can report different percentile ranks for the same tied score without either system making an arithmetic mistake.
Always identify the reference group. “80th percentile” is incomplete if readers do not know whether the comparison uses one class, a school, an age group, or a national norm sample. Changing the reference group can change the percentile while the original score stays fixed.
Why Do Percentile Methods Give Different Answers?
Percentile methods differ because a finite sample has only a limited number of observed positions. NIST states that there is no universally accepted interpolation method and describes several methods used in practice. The differences are usually small in large samples but can be visible in small ones. (NIST, accessed 2026)
Three widely used continuous methods choose slightly different locations before interpolating. Let the desired percentile be written as a decimal p, let n be the number of values, and let xj be the jth ordered value.
- R6: use the position h = (n + 1)p, with endpoint rules at the minimum and maximum.
- R7: use h = 1 + (n − 1)p. NIST identifies this as the method used by Excel and the default method in R.
- R8: use h = (n + 1/3)p + 1/3. NIST notes that Hyndman and Fan advocated this method.
If h lies between positions j and j + 1, interpolate by taking xj plus the decimal part of h times the gap to xj+1. A nearest-rank method instead rounds np upward and selects that observed value, so it never creates an in-between result.
Software must choose a default, but a default is not a universal definition. Record the program, function, or method when results will be compared across tools. This is especially important for graded work, audits, or research involving short lists.
How Do The Methods Compare In A Worked Example?
Find the 40th percentile of the ordered data 2, 4, 7, 9, 15. Here n = 5 and p = 0.40. The nearest-rank, R6, R7, and R8 methods produce 4, 5.2, 5.8, and 5.4. Each answer follows its own stated location rule.
| Method | Position | Calculation | Result |
|---|---|---|---|
| Nearest rank | ceil(5 × 0.40) = 2 | Select x2 | 4 |
| R6 | (5 + 1) × 0.40 = 2.4 | 4 + 0.4(7 − 4) | 5.2 |
| R7 | 1 + (5 − 1) × 0.40 = 2.6 | 4 + 0.6(7 − 4) | 5.8 |
| R8 | (5 + 1/3) × 0.40 + 1/3 ≈ 2.4667 | 4 + 0.4667(7 − 4) | 5.4 |
Do not average these four answers. Choose the method required by the course, software, or reporting standard. If no method is prescribed, name the one you select and apply it consistently to every group being compared.
How Do Z-Scores Convert To Normal-Model Percentiles?
A normal-model percentile uses a probability distribution rather than directly ranking a finite list. Convert the observation to a z-score, then find the cumulative area to its left under the standard normal curve. A z-score of 0 corresponds to the 50th percentile in the symmetric normal model.
The formula is z = (x − μ) ÷ σ, where x is the observation, μ is the model mean, and σ is its standard deviation. A standard normal table or cumulative distribution function then converts z into a left-tail probability. Multiply that probability by 100 for the percentile.
For example, z = 1 has cumulative probability about 0.8413, so it is near the 84.13th percentile under a normal model. This is a model-based statement. It need not match the empirical percentile rank from a small or strongly skewed data set.
The z-score calculator can standardize a value. Use a normal conversion only when the normal model is reasonable or explicitly required. Otherwise, report the percentile from the actual reference data and its chosen empirical method.
How Should You Interpret And Report A Percentile?
Report the value, percentile, group, and method together. A clear sentence is: “A score of 72 is at the 80th percentile among this semester’s 200 scores, using the R7 method.” This tells readers what was measured, who was compared, and how the position was calculated.
Avoid saying the score is “80% better” than other scores. Percentiles order values but do not measure the size of the gaps. A move from the 50th to the 60th percentile may require one point in one distribution and ten points in another.
Also avoid treating sample percentiles as exact population facts. A percentile estimated from a sample can change when more data arrive. NIST describes sample percentiles as estimates of positions in a population, which is why method and sample context matter. (NIST, accessed 2026)
- Sort empirical data before calculating.
- Check whether ties need a special rank rule.
- Name the percentile method when results must be reproducible.
- Identify the reference group and time period.
- Separate an empirical rank from a normal-model estimate.
FAQs About Percentiles
Is The 100th Percentile Always The Maximum?
Many reporting systems use the maximum as the top endpoint, but labels and interpolation rules differ. Some tests also avoid reporting 0th or 100th percentiles. Follow the stated convention rather than assuming every system handles endpoints identically.
Can Two Values Have The Same Percentile Rank?
Yes. Tied observations can receive the same percentile rank, especially under a midrank convention. The report should explain how ties are handled. Giving tied values different interpretations simply because they appear on separate rows can be misleading.
Why Does My Calculator Disagree With My Textbook?
The calculator and textbook may use different location formulas. Check for nearest rank, R6, R7, R8, inclusive, or exclusive wording. Enter the same sorted data and select the same method before treating the disagreement as an error.
Is A Quartile A Percentile?
Yes. The first quartile is the 25th percentile, the median is the 50th percentile, and the third quartile is the 75th percentile. Quartiles divide ordered data into four broad parts, while percentile language allows more detailed positions.
Use Percentiles With A Named Reference And Method
A percentile becomes meaningful only when readers know what was compared. Start with ordered data or a justified probability model, identify the reference group, and keep percentage, percentile value, and percentile rank separate.
When a small data set produces different answers, do not hide the difference. Name the method and show the position rule. That simple habit makes the result reproducible and prevents a reasonable method choice from looking like a calculation mistake.