Statistics · Why the denominator changes
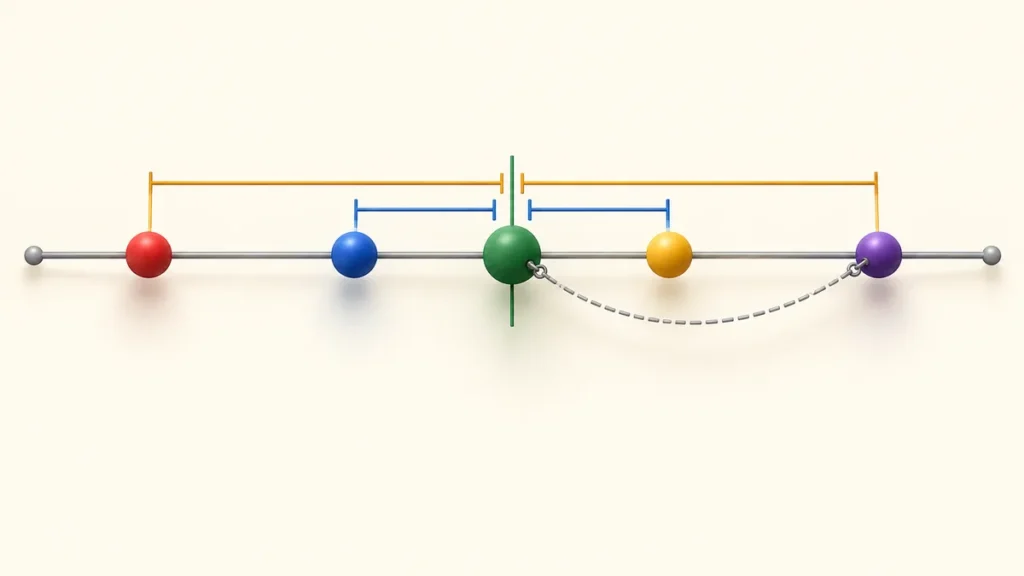
The sample mean is estimated from the same observations used to measure spread. That fitted center makes squared deviations smaller on average, and the n − 1 denominator corrects the resulting variance bias under standard sampling assumptions.
For independent observations from one population with finite variance, sample variance uses s² = Σ(x − x̄)²/(n − 1). Estimating the mean creates a constraint: the deviations must sum to zero. Dividing by n − 1, rather than n, makes this variance estimator unbiased across repeated samples.
What Does Variance Measure?
Variance measures spread using squared differences from a mean. For each observation, subtract the mean, square that deviation, and add the squares. The denominator depends on what that list represents and what you want to estimate.
The squaring prevents positive and negative deviations from canceling. For 2, 4, and 6, the mean is 4 and the deviations are −2, 0, and 2. Their sum is zero, but their squared sum is 8.
Variance has squared units. If the observations are centimeters, variance is measured in square centimeters. Standard deviation is the square root of variance and returns to centimeters.
How Does Sample Variance Differ From Population Variance?
A complete finite population’s variance describes all its listed values. Use its population mean and divide the squared-deviation sum by the population count N. No estimate of a larger unseen population is needed for that descriptive calculation.
The conventional sample variance instead estimates a population variance from a sample. It replaces the unknown population mean with the sample mean and divides by n − 1. These formulas answer related but different questions.
The same numbers can therefore produce two correct values depending on their role. For 2, 4, 6, descriptive population variance is 8/3. The conventional sample estimate is 8/2 = 4.
OpenStax distinguishes the population and sample denominators. Choose based on the data’s role, not on which result looks more convenient.
What Does Losing One Degree Of Freedom Mean?
Once deviations are measured from their own sample mean, they must sum to zero. If you know all but one deviation, the last is forced by that condition. There are n − 1 freely varying deviations within that constraint.
For three centered deviations, knowing −2 and 0 forces the third to be 2. A third deviation of 3 would not sum to zero. It would no longer describe deviations about the same sample mean.
A degree of freedom is an independently varying component after constraints are applied. The phrase does not mean you delete an observation. Every observation still contributes to the mean and squared-deviation sum.
Why Does Using The Sample Mean Reduce Squared Deviations?
The sample mean minimizes the sum of squared deviations for that particular list. Measuring around another center produces a sum at least as large. A center fitted to the sample therefore tends to make that sample look less spread out.
For 2, 4, 6, the squared sum about 4 is 8. About 5, the squared sum is 9 + 1 + 1 = 11. Moving the center away from the sample mean adds 3 to the total.
The population mean is usually unknown, so sample variance uses the fitted center. Dividing its squared sum by n would underestimate population variance on average under independent, identically distributed sampling. The correction addresses that average effect.
Can A Tiny Sampling Model Show The Bias?
Consider a hypothetical population that gives −1 and 1 with equal probability. Its mean is zero and its variance is 1. Draw two independent observations with replacement.
The four equally likely ordered samples are (−1, −1), (−1, 1), (1, −1), and (1, 1). Their within-sample squared-deviation sums are 0, 2, 2, and 0. Samples containing matching values show no within-sample spread.
Divide each sum by n = 2 and the estimates are 0, 1, 1, and 0. Their average is 0.5, below the population variance of 1. Divide by n − 1 = 1 instead and the estimates become 0, 2, 2, and 0, averaging 1.
Does Unbiased Mean Every Sample Gives The True Variance?
No. Unbiased describes the average of estimates across repeated samples under the model. An individual sample can give a value above or below the true population variance.
In the two-value model, no individual corrected estimate equals 1. Each is either 0 or 2. The average is correct even though each realized sample differs from the population value.
The correction also does not repair a poorly chosen sample. Missing groups, dependence, or recording errors can undermine the intended estimate. A formula cannot replace a valid sampling design.
How Do You Calculate Sample Variance Step By Step?
- Count the observations and require n ≥ 2.
- Calculate their sample mean.
- Subtract the mean from each observation.
- Square and add those deviations.
- Divide by n − 1.
For 2, 4, 6, n = 3 and the mean is 4. The squared sum is 4 + 0 + 4 = 8. Sample variance is 8/(3 − 1) = 4, and sample standard deviation is √4 = 2.
Keep the variance and standard deviation labels separate. Reporting 4 as the standard deviation would confuse a squared measure with its square root. The calculation can be correct while its interpretation is not.
Does The Correction Also Make Standard Deviation Unbiased?
Not generally. Taking a square root is a nonlinear transformation, so an unbiased variance estimator does not automatically produce an unbiased standard-deviation estimator. The two claims must be distinguished.
In the tiny model, corrected variances are 0, 2, 2, and 0. Their square roots average √2/2, about 0.7071, while the population standard deviation is 1. This exact example demonstrates the difference.
The conventional sample standard deviation remains widely useful for describing spread. Do not claim that its average equals the population standard deviation merely because the variance denominator is n − 1.
Which Assumptions And Boundaries Matter?
The unbiased-variance statement assumes independent observations from the same distribution with finite variance. Normality is not required for that particular result. Different sampling designs or weights may need different formulas.
For n = 1, the sample mean equals the only observation and the squared-deviation sum is zero. The corrected formula divides by zero and is undefined. One value does not provide a within-sample estimate of variation using this formula.
An empty sample is also invalid. Identical observations with n ≥ 2 give sample variance zero, which is different from an undefined result. Zero spread in one sample does not establish that the whole population has zero variance.
When Should You Divide By n Instead?
Use division by the count when describing the full population’s average squared distance from its population mean. Also distinguish a descriptive calculation on the observed list from estimating a larger population variance. State which purpose you chose.
If the true population mean is known and independent observations are used, squared deviations about that known mean can be averaged with denominator n to estimate variance. That is a different estimator from deviations about the fitted sample mean.
Do not switch denominators to make a reported result smaller or larger. Check the task’s definition, included observations, and statistical assumptions. The data size alone does not determine whether your entire target population was observed.
What Happens If You Shift Or Scale Every Observation?
Adding the same constant to every observation leaves variance unchanged. The mean shifts by that constant too, so the deviations stay identical. The sample size and denominator also remain unchanged.
Multiplying every observation by k multiplies variance by k². Each deviation receives k, then squaring contributes k². Standard deviation changes by |k| instead, which provides a useful unit-conversion check.
Practice Keeping The Two Formulas Separate
For the list 1, 3, 5, the mean is 3 and the squared sum is 8. Its descriptive population variance is 8/3; the conventional sample variance is 4. Their square roots are different too.
Then consider four identical values. Both valid variance calculations give zero because every deviation is zero. Explain why replacing that list with a single value makes the corrected sample formula undefined.
Check Spread With The Correct Definition
Identify whether your task requests sample or population statistics before comparing calculator results.
Variance calculatorStandard deviation calculatorBrowse statistics tools